This is my photogrammetry test from yesterday.
After taking some baby steps Saturday and
Monday, I felt I was ready to try a real job. We
already did the job a few weeks ago, and it is close
to home, so it was a good place to test. Originally
we did 80% of this job with the Triumph-LS and
20% total station. What I was attempting to demonstrate
was that this could have been done
entirely with the Triumph-LS with photogrammetry
and give results that are sufficiently accurate for
cadastral land surveying.
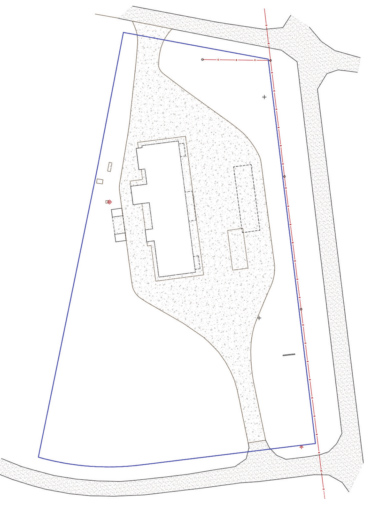
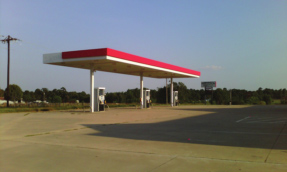
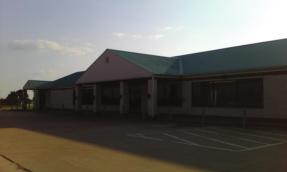
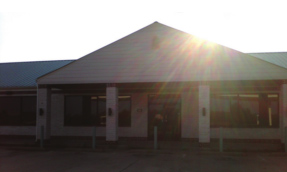
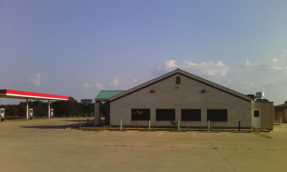
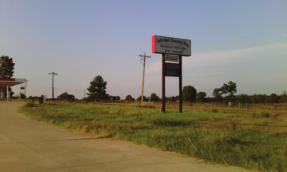
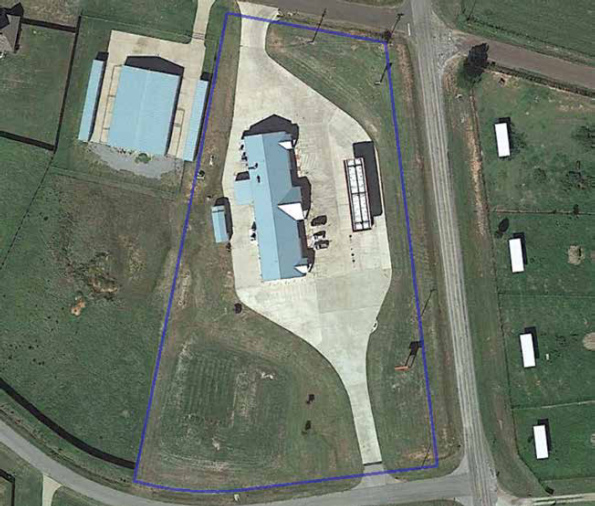
The 3.705 acre project site. It is a gas station
and convenience store. There is the main building
(approximately 180’x50’), the gas pumps with
canopy, the storage building in the back and a
large pylon sign. All of which must be located for
the survey.
In performing the photogrammetry survey, I divided this job into six sub-projects (or scenes):
Canopy (6 photos)
East Side (12 photos)
North End (6 photos)
Sign (9 photos)
South End (5 photos)
West Side (10 photos)
By dividing the job up this way, I was able to limit
the number of photos in each Camera Offset Survey
Project to less than 12. Not only is this a practical
limitation for J-Field processor, it also limits the
number of photos the user must keep up with at one
time. I began each scene by considering the points
I wanted to collect remotely by photogrammetry
and determining how to capture them with good
geometry. Once I had a general idea of where I
wanted my photos to be taken, I then set targets
(rolls of survey ribbon) in several places that would
be visible to at least a few of the images I’d collect
for the scene. I then collected control points by
normal RTK survey methods. Once I had my control
for the scene collected, I would then begin collecting
images in Camera Offset. Ideally I attempt to have
each point of interest captured in 5 photos that
spray from the point with at least 90° of dispersion
(preferably wider). It’s important to remember that
photogrammetry is 3D which requires specific points
be identified. While I may not be interested in the
elevation of a building corner, I need to specifically
target a consistent point on the building corner for the
results to work properly. When taking the images, I
make sure that the image includes the point on the
building corner that I am locating, not just the corner
itself. I also attempt to vary the distance from the
scene and the height of the camera as I capture
images. While collecting the Sign scene, I didn’t
have a good place to establish a control point, but I
noticed a pipe post that was in most of my photos,
so I located it after I collected the photos to be used
as a control point. Control points don’t need to be
artificial targets, but they need to be able to be
resolved 3 Dimensionally, from any angle. Because
the pipe is cylindrical it is a good target horizontally.
If the vertical angle though is too severe, the height
may be difficult to distinguish. That was not the case
with this pipe.
While I was collecting them in the field, I gave
the Camera Points (the points collected at the
camera location) names that related to the scene.
For instance CANOPY1, CANOPY2, CANOPY3,
etc. and E1, E2, E3, etc. Control Points were named
CP1, CP2, etc., regardless of what scene they may
have appeared in. Tie Points (points selected from
the photos) were also named based on the scene,
I included a T in the name to distinguish them from
the Camera Points (e.g. ET1, ET2, ET3).
I ended up with:
Canopy (19 points)
East Side (33 points)
North End (18 points)
Sign (12 points)
South End (14 points)
West Side (12 photos)
I am a neophyte with photogrammetry. I realize
that in most cases regarding positioning, the less
adjustment the better as adjustments may mask a
problem. Thus far, I have kept Adjust Focal Length
and Use Control Points checked with Adjust Principal
Point unchecked and Adjust Image Coordinates
unchecked. A few times I would select the wrong
control point while registering points in the image.
This would cause J-Field to take a very long time
to process as it continued to iteratively attempt
adjustments to make the wrong point work in the
solution. I found that it is a good idea to uncheck
Use Control Points for adjustment (minimally
constrained) and see what the residuals are for
the control point before proceeding. Then if the
residuals are reasonable, include them in the final
adjustment for the scene. Thus far, it seems that
the error estimates are reliable. If a point is showing
error estimates that are disproportionate to the other
points in the scene, it is likely due to the point being
poorly identified on the image or having a weak
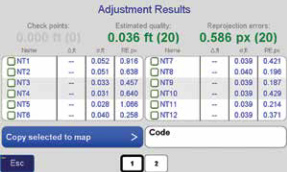
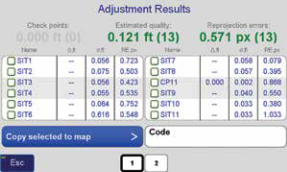
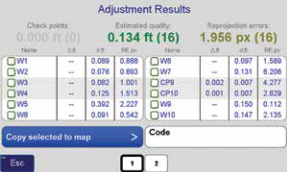
geometry establishing it. Here are some examples
of adjustment results of the six scenes:
Adjustment accuracy report, South End
Adjustment accuracy report, North End
Adjustment accuracy report, Canopy
Adjustment accuracy report, Sign
Adjustment accuracy report, West Side
Keeping up with so many points in a scene, I found it helpful to keep a scratch pad handy. I drew a
rough sketch of the scene and as I created points, I would note it on the sketch. Then as I registered the
points in other images I could look on my sketch and
quickly recall which point belonged to which feature.
The results from the adjustment appear to be
fantastic. Far superior to my expectations. So how
did they compare to the RTK/total station survey
from a few weeks ago?
Horizontal Residuals (vertical in parenthesis):
0.19’ NNWC Building - NT6
0.06’ NWC Concrete (0.10’ Height) - NT5
0.08’ NEC Building (from North End scene) - NT18
0.09’ NEC Building (from East Side scene) - ET26
0.22’ NEC Concrete (0.02’ Height) - ET27
0.06’ NEC North Awning - ET25
0.10’ SEC North Awning - ET22
0.07’ NEC Center Awning - ET19
0.21’ SEC Center Awning - ET9
0.19’ NEC South Awning - ET6
0.25’ SEC South Awning - ET3
0.10’ SEC Building (from South End scene) - S1
0.25’ SEC Building (from East Side scene) - ET2
0.29’ SEC Concrete (0.05’ Height) - ET1
0.06’ SWC Concrete (0.04’ Height) - S14
0.07’ SWC Building - S13
0.11’ SWC South Building extrusion - W9
0.07’ NWC South Building extrusion - W10
0.19’ SWC Center Building extrusion - W7
0.14’ NWC Center Building extrusion - W6
0.11’ SWC North Building extrusion - NT2
0.09’ NWC North Building extrusion - NT4
0.02’ SWC South Storage Building - W1
0.00’ SEC South Storage Building - W2
0.13’ NEC South Storage Building - W3
0.05’ SEC North Storage Building - W4
0.04’ SWC Canopy - CT18
0.06’ SEC Canopy - CT20
0.04’ NWC Sign - SIT4
0.04’ NEC Sign - SIT5
(I realize from making this report that I messed
up my point naming scheme. Point W1, for
example, should have been WT1 and S1 should
have been ST1).
If my math is correct, the average horizontal
residual is 0.106’. It should be noted that is a
comparison of coordinates from the job we did
a few weeks ago RTK/Total Station and the job
done RTK/photogrammetry. The RTK used the
same control point, 8200’ away. When viewing
these residuals, remember that this includes
differences in positions with RTK between the
two jobs as well as errors in the total station ties
that were made. Thus not all of the residuals can
be attributed to photogrammetry.
From a quick look at the adjustment results, it
does appear that the re-projection error estimate
can indicate lower accuracy even if the linear
error estimate appears to be small, as some
of the higher residuals shown above also have
higher RE, px error estimates.
The total time spent last night registering the 100+
points I created from the photos took about 4 hours.
As I mentioned earlier, the time in the field was just
under 1.5 hours. As I get more proficient, I expect
I will be able to reduce processing and field time
somewhat. This was only my third attempt at this!
This likely wasn’t as efficient as a total station survey
for the points I actually needed. The total station
setups (there were four) required an equivalent
amount of time in the field with no post processing
required. But I ended up with a lot more data than
I had with the total station. Because I pick as many
precise points that are common to several photos
as I can, I end up with extra information, such as the
location of windows and the height of the roof or the
elevation of the door threshold. Also, because it is
vital to get good coverage of the scene with photos,
I am guaranteed to have great photo documentation
in my archived file.
There are many instances in commercial industrial
environments where sites are very open, but there
are no places to set up an total station. For this
survey, I mounted the Triumph-LS to a surveyor’s
extendable prism pole and bipod, which can be set
up almost anywhere. I was collecting for 20 epochs
at 5Hz, so the time per point was very small. In high
traffic environments, this means I could get the data
(photo) very quickly and move, then determine the
actual position(s) I am interested in at some later
time through post processing. Even the quickest
total station setup generally takes me 15 minutes.
The real limitation to this is the required geometry.
If you have mobility around your scene, this is not
difficult to achieve. However, if the points you are
interested in are obscured from all but only a few
directions, or a single direction, photogrammetry
may not be the right tool. I can’t quite say I’m ready
to sell my total station, but with a bit more practice,
I think I’ll be able to produce results that are almost
as good and in some environments much safer and
more efficient.
One of the things that impresses me, is that I am
getting these kind of results on my third attempt. I’ve
only read about photogrammetry in the past and
have no practical experience with it. This speaks
well for the interface as well as the processing
algorithms. Yes I agree the desktop software would
be more convenient; having said that, it is truly
remarkable that I was able to generate every bit of
this from the LS without any outside hardware or
software required.
Regarding scale, the building is 180’ long and 50’
wide, just to give some perspective, and of course
the entire site is much larger.